
Canvas使用教程——样式与颜色应用(Applying styles and colors)
原文:https://developer.mozilla.org/en/Canvas_tutorial/Applying_styles_and_colors
In the chapter about drawing shapes I used only the default line and fill styles. In this chapter we will explore all the canvas options we have at our disposal to make our drawings a little more attractive.
Colors
Up until now we've only seen methods of the drawing context. If we want to apply colors to a shape, there are two important properties we can use: fillStyle and strokeStyle.
fillStyle = colorstrokeStyle = color
strokeStyle is used for setting the shape outline color and fillStyle is for the fill color. color can be a string representing a CSS color value, a gradient object, or a pattern object. We'll look at gradient and pattern objects later. By default, the stroke and fill color are set to black (CSS color value #000000).
The valid strings you can enter should, according to the specification, be CSS3 color values. Each of the following examples describe the same color.
- // these all set the fillStyle to 'orange'
- ctx.fillStyle = "orange";
- ctx.fillStyle = "#FFA500";
- ctx.fillStyle = "rgb(255,165,0)";
- ctx.fillStyle = "rgba(255,165,0,1)";
// these all set the fillStyle to 'orange'
ctx.fillStyle = "orange";
ctx.fillStyle = "#FFA500";
ctx.fillStyle = "rgb(255,165,0)";
ctx.fillStyle = "rgba(255,165,0,1)";
Note: Currently not all CSS 3 color values are supported in the Gecko engine. For instance the color values hsl(100%,25%,0) or rgb(0,100%,0) are not allowed. If you stick to the ones above, you won't run into any problems.
Note: If you set the strokeStyle and/or fillStyle property, the new value becomes the default for all shapes being drawn from then on. For every shape you want in a different color, you will need to reassign the fillStyle or strokeStyle property.
A fillStyle example
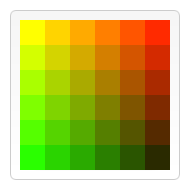
In this example, I once again use two for loops to draw a grid of rectangles, each in a different color. The resulting image should look something like the image on the right. There is nothing too spectacular happening here. I use the two variables i and j to generate a unique RGB color for each square. I only modify the red and green values. The blue channel has a fixed value. By modifying the channels, you can generate all kinds of palettes. By increasing the steps, you can achieve something that looks like the color palettes Photoshop uses.
function draw() {
- var ctx = document.getElementById('canvas').getContext('2d');
- for (var i=0;i<6;i++){
- for (var j=0;j<6;j++){
- ctx.fillStyle = 'rgb(' + Math.floor(255-42.5*i) + ',' +
- Math.floor(255-42.5*j) + ',0)';
- ctx.fillRect(j*25,i*25,25,25);
- }
- }
- }
function draw() {
  var ctx = document.getElementById('canvas').getContext('2d');
  for (var i=0;i<6;i++){
    for (var j=0;j<6;j++){
      ctx.fillStyle = 'rgb(' + Math.floor(255-42.5*i) + ',' +
                       Math.floor(255-42.5*j) + ',0)';
      ctx.fillRect(j*25,i*25,25,25);
    }
  }
}
A strokeStyle example
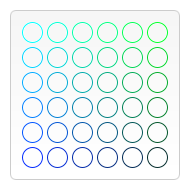
This example is similar to the one above but now using the strokeStyle property. Here I use the arc method to draw circles instead of squares.
function draw() {
- var ctx = document.getElementById('canvas').getContext('2d');
- for (var i=0;i<6;i++){
- for (var j=0;j<6;j++){
- ctx.strokeStyle = 'rgb(0,' + Math.floor(255-42.5*i) + ',' +
- Math.floor(255-42.5*j) + ')';
- ctx.beginPath();
- ctx.arc(12.5+j*25,12.5+i*25,10,0,Math.PI*2,true);
- ctx.stroke();
- }
- }
- }
function draw() {
    var ctx = document.getElementById('canvas').getContext('2d');
    for (var i=0;i<6;i++){
      for (var j=0;j<6;j++){
        ctx.strokeStyle = 'rgb(0,' + Math.floor(255-42.5*i) + ',' +
                         Math.floor(255-42.5*j) + ')';
        ctx.beginPath();
        ctx.arc(12.5+j*25,12.5+i*25,10,0,Math.PI*2,true);
        ctx.stroke();
      }
    }
  }
Transparency
Besides drawing opaque shapes to the canvas, we can also draw semi-transparent shapes. This is done by setting the globalAlpha property, or we could assign a semi-transparent color to the stroke and/or fill style.
globalAlpha = transparency value
This property applies a transparency value to all shapes drawn on the canvas. The valid range of values is from 0.0 (fully transparent) to 1.0 (fully opaque). By default, this property is set to 1.0 (fully opaque).
The globalAlpha property can be useful if you want to draw a lot of shapes on the canvas with similar transparency. I think, however, that the next option is a little more practical.
Because the strokeStyle and fillStyle properties accept CSS 3 color values, we can use the following notation to assign a transparent color to them.
- // Assigning transparent colors to stroke and fill style
- ctx.strokeStyle = "rgba(255,0,0,0.5)";
- ctx.fillStyle = "rgba(255,0,0,0.5)";
// Assigning transparent colors to stroke and fill style
ctx.strokeStyle = "rgba(255,0,0,0.5)";
ctx.fillStyle = "rgba(255,0,0,0.5)";
The rgba() function is similar to the rgb() function but it has one extra parameter. The last parameter sets the transparency value of this particular color. The valid range is again between 0.0 (fully transparent) and 1.0 (fully opaque).
A globalAlpha example
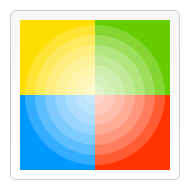
In this example I've drawn a background of four different colored squares. On top of these, I've draw a set of semi-transparent circles. The globalAlpha property is set at 0.2 which will be used for all shapes from that point on. Every step in the for loop draws a set of circles with an increasing radius. The final result is a radial gradient. By overlaying ever more circles on top of each other, we effectively reduce the transparency of the circles that have already been drawn. By increasing the step count and in effect drawing more circles, the background would completely disappear from the center of the image.
- This example doesn't work in Firefox 1.5 beta 1. You'll need a nightly branch build or wait for a newer release to see this in action.
- This example is broken on Safari as the colour is not specified correctly. Colour in example is specified as '#09F)' which is invalid according to the specification. Firefox, however, accepts the malformed colour definition.
function draw() {
- var ctx = document.getElementById('canvas').getContext('2d');
- // draw background
- ctx.fillStyle = '#FD0';
- ctx.fillRect(0,0,75,75);
- ctx.fillStyle = '#6C0';
- ctx.fillRect(75,0,75,75);
- ctx.fillStyle = '#09F';
- ctx.fillRect(0,75,75,75);
- ctx.fillStyle = '#F30';
- ctx.fillRect(75,75,150,150);
- ctx.fillStyle = '#FFF';
- // set transparency value
- ctx.globalAlpha = 0.2;
- // Draw semi transparent circles
- for (var i=0;i<7;i++){
- ctx.beginPath();
- ctx.arc(75,75,10+10*i,0,Math.PI*2,true);
- ctx.fill();
- }
- }
function draw() {
  var ctx = document.getElementById('canvas').getContext('2d');
  // draw background
  ctx.fillStyle = '#FD0';
  ctx.fillRect(0,0,75,75);
  ctx.fillStyle = '#6C0';
  ctx.fillRect(75,0,75,75);
  ctx.fillStyle = '#09F';
  ctx.fillRect(0,75,75,75);
  ctx.fillStyle = '#F30';
  ctx.fillRect(75,75,150,150);
  ctx.fillStyle = '#FFF';

  // set transparency value
  ctx.globalAlpha = 0.2;

  // Draw semi transparent circles
  for (var i=0;i<7;i++){
      ctx.beginPath();
      ctx.arc(75,75,10+10*i,0,Math.PI*2,true);
      ctx.fill();
  }
}
An example using rgba()
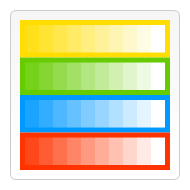
In this second example I've done something similar to the one above, but instead of drawing circles on top of each other, I've drawn small rectangles with increasing opacity. Using rgba() gives you a little more control and flexibility because we can set the fill and stroke style individually.
- function draw() {
- var ctx = document.getElementById('canvas').getContext('2d');
- // Draw background
- ctx.fillStyle = 'rgb(255,221,0)';
- ctx.fillRect(0,0,150,37.5);
- ctx.fillStyle = 'rgb(102,204,0)';
- ctx.fillRect(0,37.5,150,37.5);
- ctx.fillStyle = 'rgb(0,153,255)';
- ctx.fillRect(0,75,150,37.5);
- ctx.fillStyle = 'rgb(255,51,0)';
- ctx.fillRect(0,112.5,150,37.5);
- // Draw semi transparent rectangles
- for (var i=0;i<10;i++){
- ctx.fillStyle = 'rgba(255,255,255,'+(i+1)/10+')';
- for (var j=0;j<4;j++){
- ctx.fillRect(5+i*14,5+j*37.5,14,27.5)
- }
- }
- }
function draw() {
  var ctx = document.getElementById('canvas').getContext('2d');

  // Draw background
  ctx.fillStyle = 'rgb(255,221,0)';
  ctx.fillRect(0,0,150,37.5);
  ctx.fillStyle = 'rgb(102,204,0)';
  ctx.fillRect(0,37.5,150,37.5);
  ctx.fillStyle = 'rgb(0,153,255)';
  ctx.fillRect(0,75,150,37.5);
  ctx.fillStyle = 'rgb(255,51,0)';
  ctx.fillRect(0,112.5,150,37.5);

  // Draw semi transparent rectangles
  for (var i=0;i<10;i++){
    ctx.fillStyle = 'rgba(255,255,255,'+(i+1)/10+')';
    for (var j=0;j<4;j++){
      ctx.fillRect(5+i*14,5+j*37.5,14,27.5)
    }
  }
}
Line styles
There are several properties which allow us to style lines.
lineWidth = valuelineCap = typelineJoin = typemiterLimit = value
I could describe these in detail, but it will probably be made clearer by just looking at the examples below.
A lineWidth example
This property sets the current line thickness. Values must be positive numbers. By default this value is set to 1.0 units.
The line width is the thickness of the stroke centered on the given path. In other words, the area that's drawn extends to half the line width on either side of the path. Because canvas coordinates do not directly reference pixels, special care must be taken to obtain crisp horizontal and vertical lines.
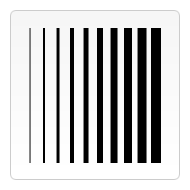
In the example below, 10 straight lines are drawn with increasing line widths. The line on the far left is 1.0 units wide. However, the leftmost and all other odd-integer-width thickness lines do not appear crisp, because of the path's positioning.
- function draw() {
- var ctx = document.getElementById('canvas').getContext('2d');
- for (var i = 0; i < 10; i++){
- ctx.lineWidth = 1+i;
- ctx.beginPath();
- ctx.moveTo(5+i*14,5);
- ctx.lineTo(5+i*14,140);
- ctx.stroke();
- }
- }
function draw() {
  var ctx = document.getElementById('canvas').getContext('2d');
  for (var i = 0; i < 10; i++){
    ctx.lineWidth = 1+i;
    ctx.beginPath();
    ctx.moveTo(5+i*14,5);
    ctx.lineTo(5+i*14,140);
    ctx.stroke();
  }
}
Obtaining crisp lines requires understanding how paths are stroked. In the images below, the grid represents the canvas coordinate grid. The squares between gridlines are actual on-screen pixels. In the first grid image below, a rectangle from (2,1) to (5,5) is filled. The entire area between them (light red) falls on pixel boundaries, so the resulting filled rectangle will have crisp edges.
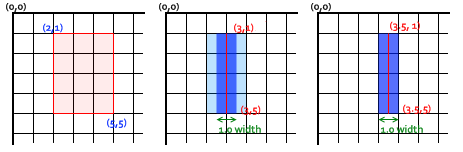
If you consider a path from (3,1) to (3,5) with a line thickness of 1.0, you end up with the situation in the second image. The actual area to be filled (dark blue) only extends halfway into the pixels on either side of the path. An approximation of this has to be rendered, which means that those pixels being only partially shaded, and results in the entire area (the light blue and dark blue) being filled in with a color only half as dark as the actual stroke color. This is what happens with the 1.0 width line in the previous example code.
To fix this, you have to be very precise in your path creation. Knowing that a 1.0 width line will extend half a unit to either side of the path, creating the path from (3.5,1) to (3.5,5) results in the situation in the third image -- the 1.0 line width ends up completely and precisely filling a single pixel vertical line.
For even-width lines, each half ends up being an integer amount of pixels, so you want a path that is between pixels (that is, (3,1) to (3,5)), instead of down the middle of pixels. Also, be aware that in our vertical line example, the Y position still referenced an integer gridline position -- if it hadn't, we would see pixels with half coverage at the endpoints.
While slightly painful when initially working with scalable 2D graphics, paying attention to the pixel grid and the position of paths ensures that your drawings will look correct regardless of scaling or any other transformations involved. A 1.0-width vertical line drawn at the correct position will become a crisp 2-pixel line when scaled up by 2, and will appear at the correct position.
A lineCap example
The lineCap property determines how the end points of every line are drawn. There are three possible values for this property and those are: butt, round and square. By default this property is set to butt.
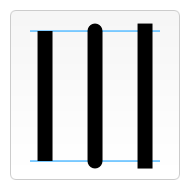
In this example, I've drawn three lines, each with a different value for the lineCap property. I also added two guides to see the exact differences between the three. Each of these lines starts and ends exactly on these guides.
The line on the left uses the default butt option. You'll notice that it's drawn completely flush with the guides. The second is set to use the round option. This adds a semicircle to the end that has a radius half the width of the line. The line on the right uses the square option. This adds a box with an equal width and half the height of the line thickness.
- function draw() {
- var ctx = document.getElementById('canvas').getContext('2d');
- var lineCap = ['butt','round','square'];
- // Draw guides
- ctx.strokeStyle = '#09f';
- ctx.beginPath();
- ctx.moveTo(10,10);
- ctx.lineTo(140,10);
- ctx.moveTo(10,140);
- ctx.lineTo(140,140);
- ctx.stroke();
- // Draw lines
- ctx.strokeStyle = 'black';
- for (var i=0;i<lineCap.length;i++){
- ctx.lineWidth = 15;
- ctx.lineCap = lineCap[i];
- ctx.beginPath();
- ctx.moveTo(25+i*50,10);
- ctx.lineTo(25+i*50,140);
- ctx.stroke();
- }
- }
function draw() {
  var ctx = document.getElementById('canvas').getContext('2d');
  var lineCap = ['butt','round','square'];

  // Draw guides
  ctx.strokeStyle = '#09f';
  ctx.beginPath();
  ctx.moveTo(10,10);
  ctx.lineTo(140,10);
  ctx.moveTo(10,140);
  ctx.lineTo(140,140);
  ctx.stroke();

  // Draw lines
  ctx.strokeStyle = 'black';
  for (var i=0;i<lineCap.length;i++){
    ctx.lineWidth = 15;
    ctx.lineCap = lineCap[i];
    ctx.beginPath();
    ctx.moveTo(25+i*50,10);
    ctx.lineTo(25+i*50,140);
    ctx.stroke();
  }
}
A lineJoin example
The lineJoin property determines how two connecting lines in a shape are joined together. There are three possible values for this property: round, bevel and miter. By default this property is set to miter.
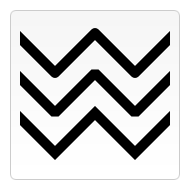
Again I've drawn three different paths, each with a different lineJoin property setting. The top path uses the round option. This setting rounds off the corners of a shape. The radius for these rounded corners is equal to the line width. The second line uses the bevel option and the line at the bottom uses the miter option. When set to miter, lines are joined by extending the outside edges to connect at a single point. This setting is effected by the miterLimit property which is explained below.
- function draw() {
- var ctx = document.getElementById('canvas').getContext('2d');
- var lineJoin = ['round','bevel','miter'];
- ctx.lineWidth = 10;
- for (var i=0;i<lineJoin.length;i++){
- ctx.lineJoin = lineJoin[i];
- ctx.beginPath();
- ctx.moveTo(-5,5+i*40);
- ctx.lineTo(35,45+i*40);
- ctx.lineTo(75,5+i*40);
- ctx.lineTo(115,45+i*40);
- ctx.lineTo(155,5+i*40);
- ctx.stroke();
- }
- }
function draw() {
  var ctx = document.getElementById('canvas').getContext('2d');
  var lineJoin = ['round','bevel','miter'];
  ctx.lineWidth = 10;
  for (var i=0;i<lineJoin.length;i++){
    ctx.lineJoin = lineJoin[i];
    ctx.beginPath();
    ctx.moveTo(-5,5+i*40);
    ctx.lineTo(35,45+i*40);
    ctx.lineTo(75,5+i*40);
    ctx.lineTo(115,45+i*40);
    ctx.lineTo(155,5+i*40);
    ctx.stroke();
  }
}
A demo of the miterLimit property
As you've seen in the previous example, when joining two lines with the miter option, the outside edges of the two joining lines are extended up to the point where they meet. For lines which are at large angles with each other, this point is not far from the inside connection point. However, when the angles between each line decreases, the distance (miter length) between these points increases exponentially.
The miterLimit property determines how far the outside connection point can be placed from the inside connection point. If two lines exceed this value, a bevel join will be drawn.
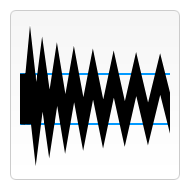
I've made a little demo in which you can set miterLimit dynamically and see how this effects the shapes on the canvas. The blue lines show where the start and endpoints for each of the lines in the zig-zag pattern are.
Gradients
Just like any normal drawing program, we can fill and stroke shapes using linear and radial gradients. We create a canvasGradient object by using one of the following methods. We use this object to assign it to the fillStyle or strokeStyle properties.
createLinearGradient(x1,y1,x2,y2)createRadialGradient(x1,y1,r1,x2,y2,r2)
The createLinearGradient method takes four arguments representing the starting point (x1,y1) and end point (x2,y2) of the gradient.
The createRadialGradient method takes six arguments. The first three arguments define a circle with coordinates (x1,y1) and radius r1 and the second a circle with coordinates (x2,y2) and radius r2.
- var lineargradient = ctx.createLinearGradient(0,0,150,150);
- var radialgradient = ctx.createRadialGradient(75,75,0,75,75,100);
var lineargradient = ctx.createLinearGradient(0,0,150,150);
var radialgradient = ctx.createRadialGradient(75,75,0,75,75,100);
Once we've created a canvasGradient object we can assign colors to it by using the addColorStop method.
addColorStop(position, color)
This method takes two arguments. The position must be a number between 0.0 and 1.0 and defines the relative position of the color in the gradient. Setting this to 0.5 for instance would place the color precisely in the middle of the gradient. The color argument must be a string representing a CSS color (ie #FFF, rgba(0,0,0,1),etc).
You can add as many color stops to a gradient as you need. Below is a very simple linear gradient from white to black.
- var lineargradient = ctx.createLinearGradient(0,0,150,150);
- lineargradient.addColorStop(0,'white');
- lineargradient.addColorStop(1,'black');
var lineargradient = ctx.createLinearGradient(0,0,150,150);
lineargradient.addColorStop(0,'white');
lineargradient.addColorStop(1,'black');
A createLinearGradient example
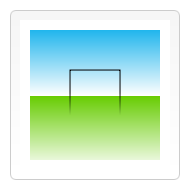
In this example, I've created two different gradients. In the first, I create the background gradient. As you can see, I've assigned two colors at the same position. You do this to make very sharp color transitions - in this case from white to green. Normally, it doesn't matter in what order you define the color stops, but in this special case, it does significantly. If you keep the assignments in the order you want them to appear, this won't be a problem.
In the second gradient, I didn't assign the starting color (at position 0.0) since it wasn't strictly necessary. Assigning the black color at position 0.5 automatically makes the gradient, from the start to this stop, black.
As you can see here, both the strokeStyle and fillStyle properties can accept a canvasGradient object as valid input.
- function draw() {
- var ctx = document.getElementById('canvas').getContext('2d');
- // Create gradients
- var lingrad = ctx.createLinearGradient(0,0,0,150);
- lingrad.addColorStop(0, '#00ABEB');
- lingrad.addColorStop(0.5, '#fff');
- //lingrad.addColorStop(0.5, '#26C000');
- //lingrad.addColorStop(1, '#fff');
- var lingrad2 = ctx.createLinearGradient(0,50,0,95);
- lingrad2.addColorStop(0.5, '#000');
- lingrad2.addColorStop(1, 'rgba(0,0,0,0)');
- // assign gradients to fill and stroke styles
- ctx.fillStyle = lingrad;
- ctx.strokeStyle = lingrad2;
- // draw shapes
- ctx.fillRect(10,10,130,130);
- ctx.strokeRect(50,50,50,50);
- }
function draw() {
  var ctx = document.getElementById('canvas').getContext('2d');

  // Create gradients
  var lingrad = ctx.createLinearGradient(0,0,0,150);
  lingrad.addColorStop(0, '#00ABEB');
  lingrad.addColorStop(0.5, '#fff');
  //lingrad.addColorStop(0.5, '#26C000');
  //lingrad.addColorStop(1, '#fff');

  var lingrad2 = ctx.createLinearGradient(0,50,0,95);
  lingrad2.addColorStop(0.5, '#000');
  lingrad2.addColorStop(1, 'rgba(0,0,0,0)');

  // assign gradients to fill and stroke styles
  ctx.fillStyle = lingrad;
  ctx.strokeStyle = lingrad2;

  // draw shapes
  ctx.fillRect(10,10,130,130);
  ctx.strokeRect(50,50,50,50);

}
A createRadialGradient example
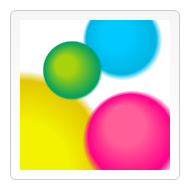
In this example, I've defined four different radial gradients. Because we have control over the start and closing points of the gradient, we can achieve more complex effects than we would normally have in the 'classic' radial gradients we see in, for instance, Photoshop. (i.e. a gradient with a single center point where the gradient expands outward in a circular shape.)
In this case, I've offset the starting point slightly from the end point to achieve a spherical 3D effect. It's best to try to avoid letting the inside and outside circles overlap because this results in strange effects which are hard to predict.
The last color stop in each of the four gradients uses a fully transparent color. If you want to have a nice transition from this to the previous color stop, both colors should be equal. This isn't very obvious from the code because I've used two different CSS color methods, but in the first gradient #019F62 = rgba(1,159,98,1)
- function draw() {
- var ctx = document.getElementById('canvas').getContext('2d');
- // Create gradients
- var radgrad = ctx.createRadialGradient(45,45,10,52,50,30);
- radgrad.addColorStop(0, '#A7D30C');
- radgrad.addColorStop(0.9, '#019F62');
- radgrad.addColorStop(1, 'rgba(1,159,98,0)');
- var radgrad2 = ctx.createRadialGradient(105,105,20,112,120,50);
- radgrad2.addColorStop(0, '#FF5F98');
- radgrad2.addColorStop(0.75, '#FF0188');
- radgrad2.addColorStop(1, 'rgba(255,1,136,0)');
- var radgrad3 = ctx.createRadialGradient(95,15,15,102,20,40);
- radgrad3.addColorStop(0, '#00C9FF');
- radgrad3.addColorStop(0.8, '#00B5E2');
- radgrad3.addColorStop(1, 'rgba(0,201,255,0)');
- var radgrad4 = ctx.createRadialGradient(0,150,50,0,140,90);
- radgrad4.addColorStop(0, '#F4F201');
- radgrad4.addColorStop(0.8, '#E4C700');
- radgrad4.addColorStop(1, 'rgba(228,199,0,0)');
- // draw shapes
- ctx.fillStyle = radgrad4;
- ctx.fillRect(0,0,150,150);
- ctx.fillStyle = radgrad3;
- ctx.fillRect(0,0,150,150);
- ctx.fillStyle = radgrad2;
- ctx.fillRect(0,0,150,150);
- ctx.fillStyle = radgrad;
- ctx.fillRect(0,0,150,150);
- }
function draw() {
  var ctx = document.getElementById('canvas').getContext('2d');

  // Create gradients
  var radgrad = ctx.createRadialGradient(45,45,10,52,50,30);
  radgrad.addColorStop(0, '#A7D30C');
  radgrad.addColorStop(0.9, '#019F62');
  radgrad.addColorStop(1, 'rgba(1,159,98,0)');

  var radgrad2 = ctx.createRadialGradient(105,105,20,112,120,50);
  radgrad2.addColorStop(0, '#FF5F98');
  radgrad2.addColorStop(0.75, '#FF0188');
  radgrad2.addColorStop(1, 'rgba(255,1,136,0)');

  var radgrad3 = ctx.createRadialGradient(95,15,15,102,20,40);
  radgrad3.addColorStop(0, '#00C9FF');
  radgrad3.addColorStop(0.8, '#00B5E2');
  radgrad3.addColorStop(1, 'rgba(0,201,255,0)');

  var radgrad4 = ctx.createRadialGradient(0,150,50,0,140,90);
  radgrad4.addColorStop(0, '#F4F201');
  radgrad4.addColorStop(0.8, '#E4C700');
  radgrad4.addColorStop(1, 'rgba(228,199,0,0)');

  // draw shapes
  ctx.fillStyle = radgrad4;
  ctx.fillRect(0,0,150,150);
  ctx.fillStyle = radgrad3;
  ctx.fillRect(0,0,150,150);
  ctx.fillStyle = radgrad2;
  ctx.fillRect(0,0,150,150);
  ctx.fillStyle = radgrad;
  ctx.fillRect(0,0,150,150);
}
Patterns
In one of the examples on the previous page, I used a series of loops to create a pattern of images. There is, however, a much simpler method: the createPattern method.
createPattern(image,type)
This method takes two arguments. Image is either a reference to an Image object or a different canvas element. Type must be a string containing one of the following values: repeat, repeat-x, repeat-y and no-repeat.
Image argument does not work in Firefox 1.5 (Gecko 1.8)We use this method to create a Pattern object which is very similar to the gradient methods we've seen above. Once we've created a pattern, we can assign it to the fillStyle or strokeStyle properties.
- var img = new Image();
- img.src = 'someimage.png';
- var ptrn = ctx.createPattern(img,'repeat');
var img = new Image();
img.src = 'someimage.png';
var ptrn = ctx.createPattern(img,'repeat');
Note: Unlike the drawImage method, you must make sure the image you use is loaded before calling this method or the pattern may be drawn incorrectly.
Note: Firefox currently only supports the repeat property. If you assign anything else, you won't see any changes.
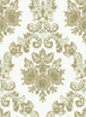
A createPattern example
In this last example, I created a pattern which I assigned to the fillStyle property. The only thing worth noting is the use of the Image object onload handler. This is to make sure the image is loaded before it is assigned to the pattern.
function
draw() {- var ctx = document.getElementById('canvas').getContext('2d');
- // create new image object to use as pattern
- var img = new Image();
- img.src = 'images/wallpaper.png';
- img.onload = function(){
- // create pattern
- var ptrn = ctx.createPattern(img,'repeat');
- ctx.fillStyle = ptrn;
- ctx.fillRect(0,0,150,150);
- }
- }
function draw() {
  var ctx = document.getElementById('canvas').getContext('2d');

  // create new image object to use as pattern
  var img = new Image();
  img.src = 'images/wallpaper.png';
  img.onload = function(){

    // create pattern
    var ptrn = ctx.createPattern(img,'repeat');
    ctx.fillStyle = ptrn;
    ctx.fillRect(0,0,150,150);

  }
}
Shadows
Firefox 3.5 (Gecko 1.9.1) introduced support for shadows in canvases. Using shadows involves just four properties:
shadowOffsetX = floatshadowOffsetY = floatshadowBlur = floatshadowColor = color
shadowOffsetX and shadowOffsetY indicate how far the shadow should extend from the object in the X and Y directions; these values aren't affected by the current transformation matrix. Use negative values to cause the shadow to extend up or to the left, and positive values to cause the shadow to extend down or to the right. These are both 0 by default.
shadowBlur indicates the size of the blurring effect; this value doesn't correspond to a number of pixels and is not affected by the current transformation matrix. The default value is 0.
shadowColor is a standard CSS color value indicating the color of the shadow effect; by default, it is fully-transparent black.
A shadowed text example
This example draws a text string with a shadowing effect.
加支付宝好友偷能量挖...