
超过13个非常有用的Flex/Flash调试工具
有用过FireBug调试Ajax,JavaScript经验的人应该都非常清楚Firebug的强大以及易用性。而我们创建RIA应用的时候一般都是在Flex Builder或者Flash CS3中调试,尽管可以满足我们的需求,不过作为Web的应用,总归没有Firebug那样用起来方便。Ntt.cc罗列了一个除了本身编译器外的Flex/Flash调试列表《the list of helpful Flex or Flash debug tools》。
其中就不乏像Firebug那样方便的调试工具。这些工具让我很是享用,尤其是Debugging AS3 with firebug’s console和FlashTracer的组合使用,效率上增进不少。
Reflexutil allows Adobe Flex developers to debug and alter properties of components while running an application.
Flex-Spy allow you to inspect and dynamically change most properties and styles of the visual components in your Flex application.
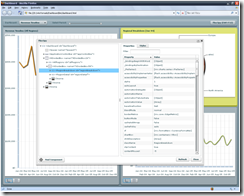
XMLObjectOutput is a really cool tool for debugging when you are writing Flex Apps. It is somewhat similar to CFDump and displays the structure of any Object in Flex.
 Flash Switcher extension for Firefox
This extension comes with all the currently published flash player plugins (from the version 2 to the most recent 9,0,16) and allows you to easily switch from one plugin to another, or also to remove the currently installed plugin (maybe for testing the express install).
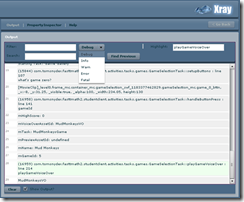
For real-time debugging and spying on your code. It is 16KB for the connector that you add to your files but it is debugging in style. If you have any issues with a live app or to help during testing Xray is great. It also includes a nifty admin site that allows you to access objects and spy on your code at any time.

Xray (The AdminTool) is a “snapshot viewer” of the current state of your Flash application without impacting the performance or the file size of your application. Xray’s true nature is to look into the very guts of the Flash application and disolve the 2d myth you see on screen to a 3D tangible entity you can truly crawl through.
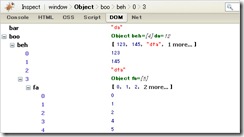
Debugging AS3 with firebug’s console
When using Firebug (a web developers Swiss army knife for browser debugging) you can also use actionscript to write to the firebug console with this class from marcosweskamp.
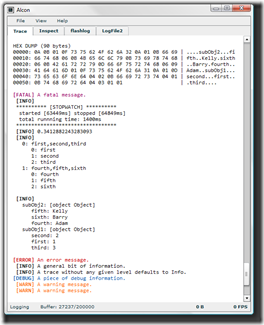
Alcon (ActionScript Logging Console) is a lightweight debugging tool for ActionScript 2.0/3.0 developers that provide a way to output debugging information (traces) from the debugged application to an external output panel.
Main features:
 Multiple output levels (LOG, DEBUG, INFO, WARN, ERROR, FATAL)
Inspection for Object and MovieClip types
Multiple output targets using Publishers (similar to log4j)
Flash 6 & 7 compatible. Flex is also supported.
Small filesize, about 3kb with all available publishers.
GUI Console for viewing and inspecting log messages.
DebugIt is a two-piece debugging tool designed to help developer debug Flash applications and content outside of the Flash authoring environment. Displays traced data in a seperate SWF so you can debug outside of Flash, while running your application in its shell/production environment.
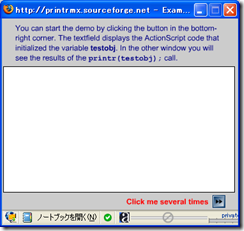
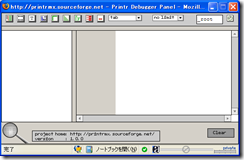
Brings PHP‘s “print_r” to Flash, invaluable once you start to use it. Free, Complete Source Available.
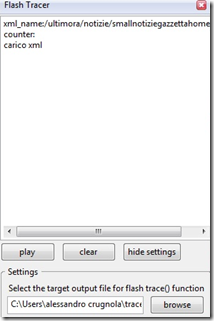
JAVA application which displays traced data from SWF and other (PHP,Java…). It is created for retrieving xml log data from Flash Swf aplications which are using XmlSocketConnection.Could be a command line or windowed application.
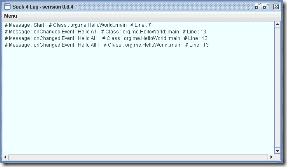
ThunderBolt is a logger extension for Flash ActionScript 2 and 3 as well as Flex 2 and 3 applications based on the Firebug add-on for Firefox.
It is a firefox add on that displays trace() output in a sidebar window.While running any .swf Flash file in your browser you can see all the output generated by the "trace" flash functions in this sidebar component.
加支付宝好友偷能量挖...