
16.7.为图表的元素更换皮肤
16.7.1. 问题
我需要改变图表项目的外观。
16.7.2. 解决办法
创建一个skin 类,该类需要继承ProgrammaticSkin 类和实现IdataRenderer 类的接口。将此类设置为图表的ChartSeries 类的渲染器。
16.7.3. 讨论
mx.charts.ChartItem代表图表数列中一个数据点,每个数列的数据提供器都有一个ChartItem。
ChartItem 定义以下属性:
currentState : String
Defines the appearance of the ChartItem.
定义ChartItem 的外观。
element : IChartElement
The series or element that owns the ChartItem.
使用ChartItem 的数列和元素
index : int
The index of the data from the series' dataProvider that the ChartItem represents.
ChartItem 所代表的数据提供器中数据的索引
item : Object
The item from the series' dataProvider that the ChartItem represents.
ChartItem 代表的数列的数据提供器中的项目
itemRenderer : IFlexDisplayObject
The instance of the chart's item renderer that represents this ChartItem.
当前ChartItem 的图表项目渲染器实例。
The ChartItem is owned by a ChartSeries, which uses the items to display the data points.
ChartItem 属于ChartSeries,它使用项目条来显示数据点。
ChartSeries 属于一个图表,它拥有一个或多个ChartSeries 条目,这些条目具有单独的数据属性。
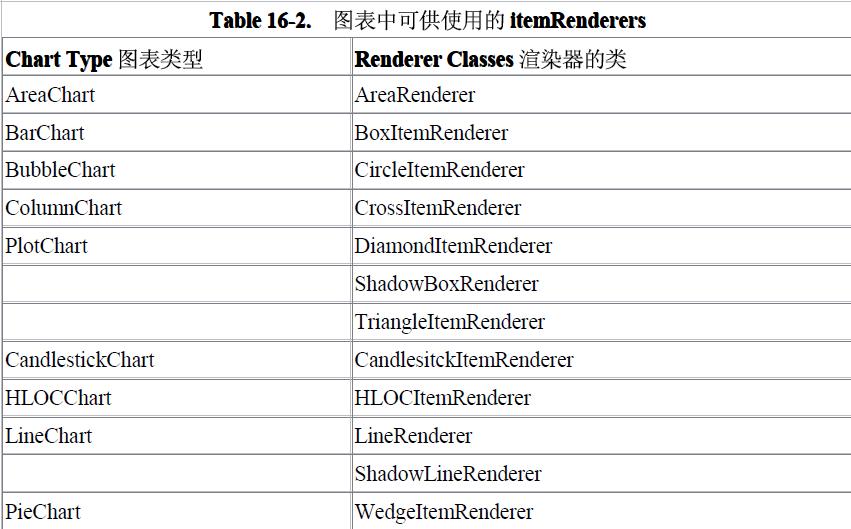
每个数列有一个默认的数据渲染器,flex 使用这个渲染器来描绘数列的ChartItem 对象,如表16-2 所列。使用数列的itemRenderer 样式属性可以定义一个新的渲染器。这个属性指向一个定义ChartItem 对象外观的类。
将一张图片设定为图表数列的itemRenderer,只需简单地把已嵌入的图片设置为itemRenderer 的属性即可。
为图表的条目创建皮肤,需要创建一个ProgrammaticSkin 类,并且覆盖updateDisplayList()方法:
现在ProgrammaticSkin 类就可以设置为列状图的itemRenderer。
我需要改变图表项目的外观。
16.7.2. 解决办法
创建一个skin 类,该类需要继承ProgrammaticSkin 类和实现IdataRenderer 类的接口。将此类设置为图表的ChartSeries 类的渲染器。
16.7.3. 讨论
mx.charts.ChartItem代表图表数列中一个数据点,每个数列的数据提供器都有一个ChartItem。
ChartItem 定义以下属性:
currentState : String
Defines the appearance of the ChartItem.
定义ChartItem 的外观。
element : IChartElement
The series or element that owns the ChartItem.
使用ChartItem 的数列和元素
index : int
The index of the data from the series' dataProvider that the ChartItem represents.
ChartItem 所代表的数据提供器中数据的索引
item : Object
The item from the series' dataProvider that the ChartItem represents.
ChartItem 代表的数列的数据提供器中的项目
itemRenderer : IFlexDisplayObject
The instance of the chart's item renderer that represents this ChartItem.
当前ChartItem 的图表项目渲染器实例。
The ChartItem is owned by a ChartSeries, which uses the items to display the data points.
ChartItem 属于ChartSeries,它使用项目条来显示数据点。
ChartSeries 属于一个图表,它拥有一个或多个ChartSeries 条目,这些条目具有单独的数据属性。
每个数列有一个默认的数据渲染器,flex 使用这个渲染器来描绘数列的ChartItem 对象,如表16-2 所列。使用数列的itemRenderer 样式属性可以定义一个新的渲染器。这个属性指向一个定义ChartItem 对象外观的类。
将一张图片设定为图表数列的itemRenderer,只需简单地把已嵌入的图片设置为itemRenderer 的属性即可。
+展开
-XML
<mx:PlotSeries xField="goals" yField="games" displayName="Goals per game" itemRenderer="@Embed(source='../assets/soccerball.png")" radius="20" legendMarkerRenderer="
@Embed(source='../assets/soccerball.png')"/>
@Embed(source='../assets/soccerball.png')"/>
为图表的条目创建皮肤,需要创建一个ProgrammaticSkin 类,并且覆盖updateDisplayList()方法:
+展开
-ActionScript
package oreilly.cookbook
{
import flash.display.BitmapData;
import flash.display.DisplayObject;
import flash.display.IBitmapDrawable;
import mx.charts.series.items.ColumnSeriesItem;
import mx.core.IDataRenderer;
import mx.skins.ProgrammaticSkin;
public class CustomRenderer extends ProgrammaticSkin implements
IDataRenderer {
private var _chartItem:ColumnSeriesItem;
[Embed(source="../../assets/Shakey.png")]
private var img:Class;
public function get data():Object {
return _chartItem;
}
public function set data(value:Object):void {
_chartItem = value as ColumnSeriesItem;
invalidateDisplayList();
}
override protected function
updateDisplayList(unscaledWidth:Number,
unscaledHeight:Number):void
{
super.updateDisplayList(unscaledWidth, unscaledHeight);
var img_inst = new img();
var bmd:BitmapData = new BitmapData((img_inst as
DisplayObject).height,
(foo_inst as DisplayObject).width, true);
bmd.draw(img_inst as IBitmapDrawable);
graphics.clear();
graphics.beginBitmapFill(bmd);
graphics.drawRect(0, 0, unscaledWidth, unscaledHeight);
graphics.endFill();
}
}
}
{
import flash.display.BitmapData;
import flash.display.DisplayObject;
import flash.display.IBitmapDrawable;
import mx.charts.series.items.ColumnSeriesItem;
import mx.core.IDataRenderer;
import mx.skins.ProgrammaticSkin;
public class CustomRenderer extends ProgrammaticSkin implements
IDataRenderer {
private var _chartItem:ColumnSeriesItem;
[Embed(source="../../assets/Shakey.png")]
private var img:Class;
public function get data():Object {
return _chartItem;
}
public function set data(value:Object):void {
_chartItem = value as ColumnSeriesItem;
invalidateDisplayList();
}
override protected function
updateDisplayList(unscaledWidth:Number,
unscaledHeight:Number):void
{
super.updateDisplayList(unscaledWidth, unscaledHeight);
var img_inst = new img();
var bmd:BitmapData = new BitmapData((img_inst as
DisplayObject).height,
(foo_inst as DisplayObject).width, true);
bmd.draw(img_inst as IBitmapDrawable);
graphics.clear();
graphics.beginBitmapFill(bmd);
graphics.drawRect(0, 0, unscaledWidth, unscaledHeight);
graphics.endFill();
}
}
}
现在ProgrammaticSkin 类就可以设置为列状图的itemRenderer。
+展开
-XML
<mx:ColumnChart id="column" dataProvider="{expenses}">
<mx:horizontalAxis>
<mx:CategoryAxis dataProvider="{expenses}" categoryField="Month" />
</mx:horizontalAxis>
<mx:series>
<mx:Array>
<mx:ColumnSeries xField="Month" yField="Expenses" displayName="Expenses" itemRenderer="oreilly.cookbook.CustomRenderer" />
</mx:Array>
</mx:series>
</mx:ColumnChart>
<mx:horizontalAxis>
<mx:CategoryAxis dataProvider="{expenses}" categoryField="Month" />
</mx:horizontalAxis>
<mx:series>
<mx:Array>
<mx:ColumnSeries xField="Month" yField="Expenses" displayName="Expenses" itemRenderer="oreilly.cookbook.CustomRenderer" />
</mx:Array>
</mx:series>
</mx:ColumnChart>
加支付宝好友偷能量挖...