
Ext4+通过服务器返回值动态创建多条折线图
如果服务器返回的折线图数据的字段是动态创建,ext4+如何使用这种数据动态创建多条折线图。
例如,服务器返回如下的数据
{fields:["2013-8-7","2013-8-8"],"rows":[{"hour":"0","2013-8-7":94,"2013-8-8":54},{"hour":"1","2013-8-7":31,"2013-8-8":51},{"hour":"2","2013-8-7":41,"2013-8-8":25},{"hour":"3","2013-8-7":75,"2013-8-8":70},{"hour":"4","2013-8-7":95,"2013-8-8":96},{"hour":"5","2013-8-7":87,"2013-8-8":11},{"hour":"6","2013-8-7":89,"2013-8-8":54},{"hour":"7","2013-8-7":59,"2013-8-8":43},{"hour":"8","2013-8-7":88,"2013-8-8":69},{"hour":"9","2013-8-7":93,"2013-8-8":87},{"hour":"10","2013-8-7":87,"2013-8-8":71},{"hour":"11","2013-8-7":23,"2013-8-8":58},{"hour":"12","2013-8-7":92,"2013-8-8":48},{"hour":"13","2013-8-7":48,"2013-8-8":48},{"hour":"14","2013-8-7":40,"2013-8-8":10},{"hour":"15","2013-8-7":29,"2013-8-8":68},{"hour":"16","2013-8-7":21,"2013-8-8":64},{"hour":"17","2013-8-7":85,"2013-8-8":89},{"hour":"18","2013-8-7":56,"2013-8-8":57},{"hour":"19","2013-8-7":21,"2013-8-8":16},{"hour":"20","2013-8-7":92,"2013-8-8":60},{"hour":"21","2013-8-7":60,"2013-8-8":49},{"hour":"22","2013-8-7":17,"2013-8-8":58},{"hour":"23","2013-8-7":50,"2013-8-8":62}]}
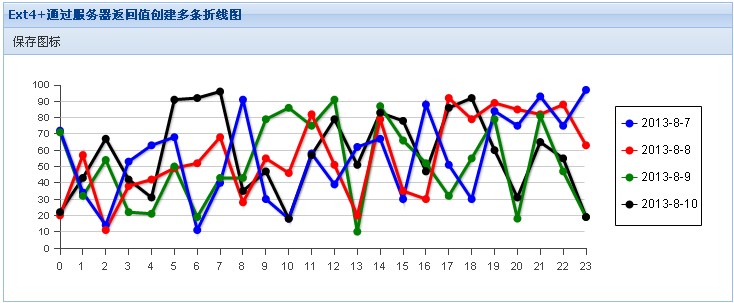
表示一个时间段内24小时的数据监控,时间段是可以随便修改的,如通过指定时间段查询得到监控数据。对于这种数据,由于字段名称是动态的,所以配置model对象比较困难,没有找到动态配置store对象model的方法,如从服务器返回的数据中哪个是配置model的。
说那么多还不如直接看示例,效果如下
源代码如下
test.html
<!DOCTYPE HTML PUBLIC "-//W3C//DTD HTML 4.01//EN" "http://www.w3.org/TR/html4/strict.dtd">
<html>
<head>
<meta http-equiv="Content-Type" content="text/html; charset=utf-8" />
<title>Ext4+通过服务器返回值动态创建多条折线图</title>
<link rel="stylesheet" type="text/css" href="../../resources/css/ext-all.css" />
<link rel="stylesheet" type="text/css" href="../shared/example.css" />
<script type="text/javascript" src="../../ext-all.js"></script>
<script type="text/javascript">
    var downloadChart = function (chart) {
        Ext.MessageBox.confirm('确认下载', '确认要保存图表为图片?!', function (choice) {
            if (choice == 'yes') {
                chart.save({
                    type: 'image/png'
                });
            }
        });
    };
    function createChart(d) {
        var fields = (d.fields.join(',') + ',hour').split(',');//重新生成fields,添加固定字段hour。防止定义坐标轴时,hour数据如果和日期数据部不一致,会导致绘图失败。
        Ext.define('DynamicMulLineChart', {
            extend: 'Ext.data.Model',
            fields: fields
        });
        var store = Ext.create('Ext.data.Store', {
            model: 'DynamicMulLineChart',
            data: d.rows
        });
        var series = []//动态创建series配置数组
        , colors = ['blue', 'red', 'green', 'black', 'yellow', '#38B8BF', '#999999', '#4D90FE']; //定义每条折线的颜色,简单示例,此数组长度要大于等于返回的fields的长度
        for (var i = 0, j = d.fields.length; i < j; i++)
            (function (i) {//需要做闭包,tips要获取对应的项目数据
                series[i] = {
                    type: 'line',
                    axis: 'left',
                    xField: 'hour',
                    yField: d.fields[i], //
                    tips: {
                        trackMouse: true,
                        width: 100,
                        height: 40,
                        renderer: function (storeItem, item) {
                            this.setTitle(d.fields[i] + ' ' + storeItem.get('hour') + '时<br/>数据:' + storeItem.get(d.fields[i]));
                        }
                    },
                    style: {
                        fill: colors[i],
                        stroke: colors[i],
                        'stroke-width': 3
                    },
                    markerConfig: {
                        type: 'circle',
                        size: 4,
                        radius: 4,
                        'stroke-width': 0,
                        fill: colors[i],
                        stroke: colors[i]
                    }
                };
             })(i)


        var chart2 = Ext.create('Ext.chart.Chart', {
            xtype: 'chart',
            animate: false,
            store: store,
            insetPadding: 30,
            axes: [{
                type: 'Numeric',
                minimum: 0,
                position: 'left',
                fields: d.fields,//y轴,由于小时和当天此时的数据都是数字,所以可以直接设置,需要移除hour字段,要不可能导致绘图出问题
                title: false,
                grid: true,
                label: {
                    renderer: Ext.util.Format.numberRenderer('0,0'),
                    font: '10px Arial'
                }
            }, {
                type: 'Category',
                position: 'bottom',
                fields: ['hour'], //x轴
                title: false,
                label: {
                    font: '11px Arial'
                }
            }],
            legend: {
                position: 'right'
            },
            series:series
        });
        var panel2 = Ext.create('widget.panel', {
            width: 730,
            height: 300,
            title: 'Ext4+通过服务器返回值动态创建多条折线图',
            renderTo: Ext.getBody(),
            layout: 'fit',
            tbar: [{
                text: '保存图标',
                handler: function () { downloadChart(chart2); }
            }],
            items: chart2
        });
    }
    Ext.onReady(function () {
        //由于返回的日期是动态创建的,所以Model不能直接定义(不知道ext是否支持动态meta定义,从服务器返回的某个字段中获取,暂时没找到这种定义方法)
        //所以首先通过ajax获取到服务器返回的数据,获取到动态创建的字段后再定义Model
        Ext.Ajax.request({
            url: 'data.asp',
            success: function (xhr) {
                var d = Ext.decode(xhr.responseText);
                createChart(d);
            },
            failure: function (xhr) { alert('动态页有问题!status:' + xhr.status + '\n' + xhr.responseText) }
        });
    });
</script>
</head>
<body>
</body>
</html>
data.asp
<%
Randomize
Function rndint(byval MaxNum,byval MinNum)'asp生成整数之间的随机数函数
  dim tmp
  if MaxNum<MinNum then'交换大小值,防止传递时大小搞反
    tmp=MinNum:MinNum=MaxNum:MaxNum=tmp
  end if

  rndint=int(rnd *(MaxNum-MinNum+1)+MinNum)
End Function
dNow=now
d=rndint(1,7)'随机生成从今天及之后的1~7天数据
dim fds(),s,sfd
redim fds(d)
fds(0)=year(dNow)&"-"&month(dNow)&"-"&day(dNow)'用于生成日期数据的
sfd=""""&fds(0)&"""" '返回给ext用于生成折线图的字段名称
for i=1 to d
  dNow=dateadd("d",1,dNow)
  fds(i)=year(dNow)&"-"&month(dNow)&"-"&day(dNow)
  sfd=sfd&","""&fds(i)&""""
next
for i=0 to 23'随机生成24个小时的监控数据,10~100之间
  s=s&",{""hour"":"""&i&""""
  for j=0 to d'生成每个小时的日期数据
    s=s&","""&fds(j)&""":"&rndint(10,100)
  next
  s=s&"}"
next
s=right(s,len(s)-1)
response.Write "{fields:["& sfd &"],""rows"":["& s &"]}"
%>
加支付宝好友偷能量挖...

原创文章,转载请注明出处:Ext4+通过服务器返回值动态创建多条折线图